7 Advanced Console Logging Techniques for Debugging Deeply Nested JavaScript Objects
Jamal Washington
Infrastructure Lead

When debugging complex JavaScript applications, the standard console.log() often falls short when dealing with deeply nested objects. The output gets truncated, showing frustrating [Object] placeholders instead of the actual data you need. In this guide, we'll explore advanced console logging techniques that will transform your debugging workflow and help you visualize complex data structures with ease.
The Problem with Standard console.log()
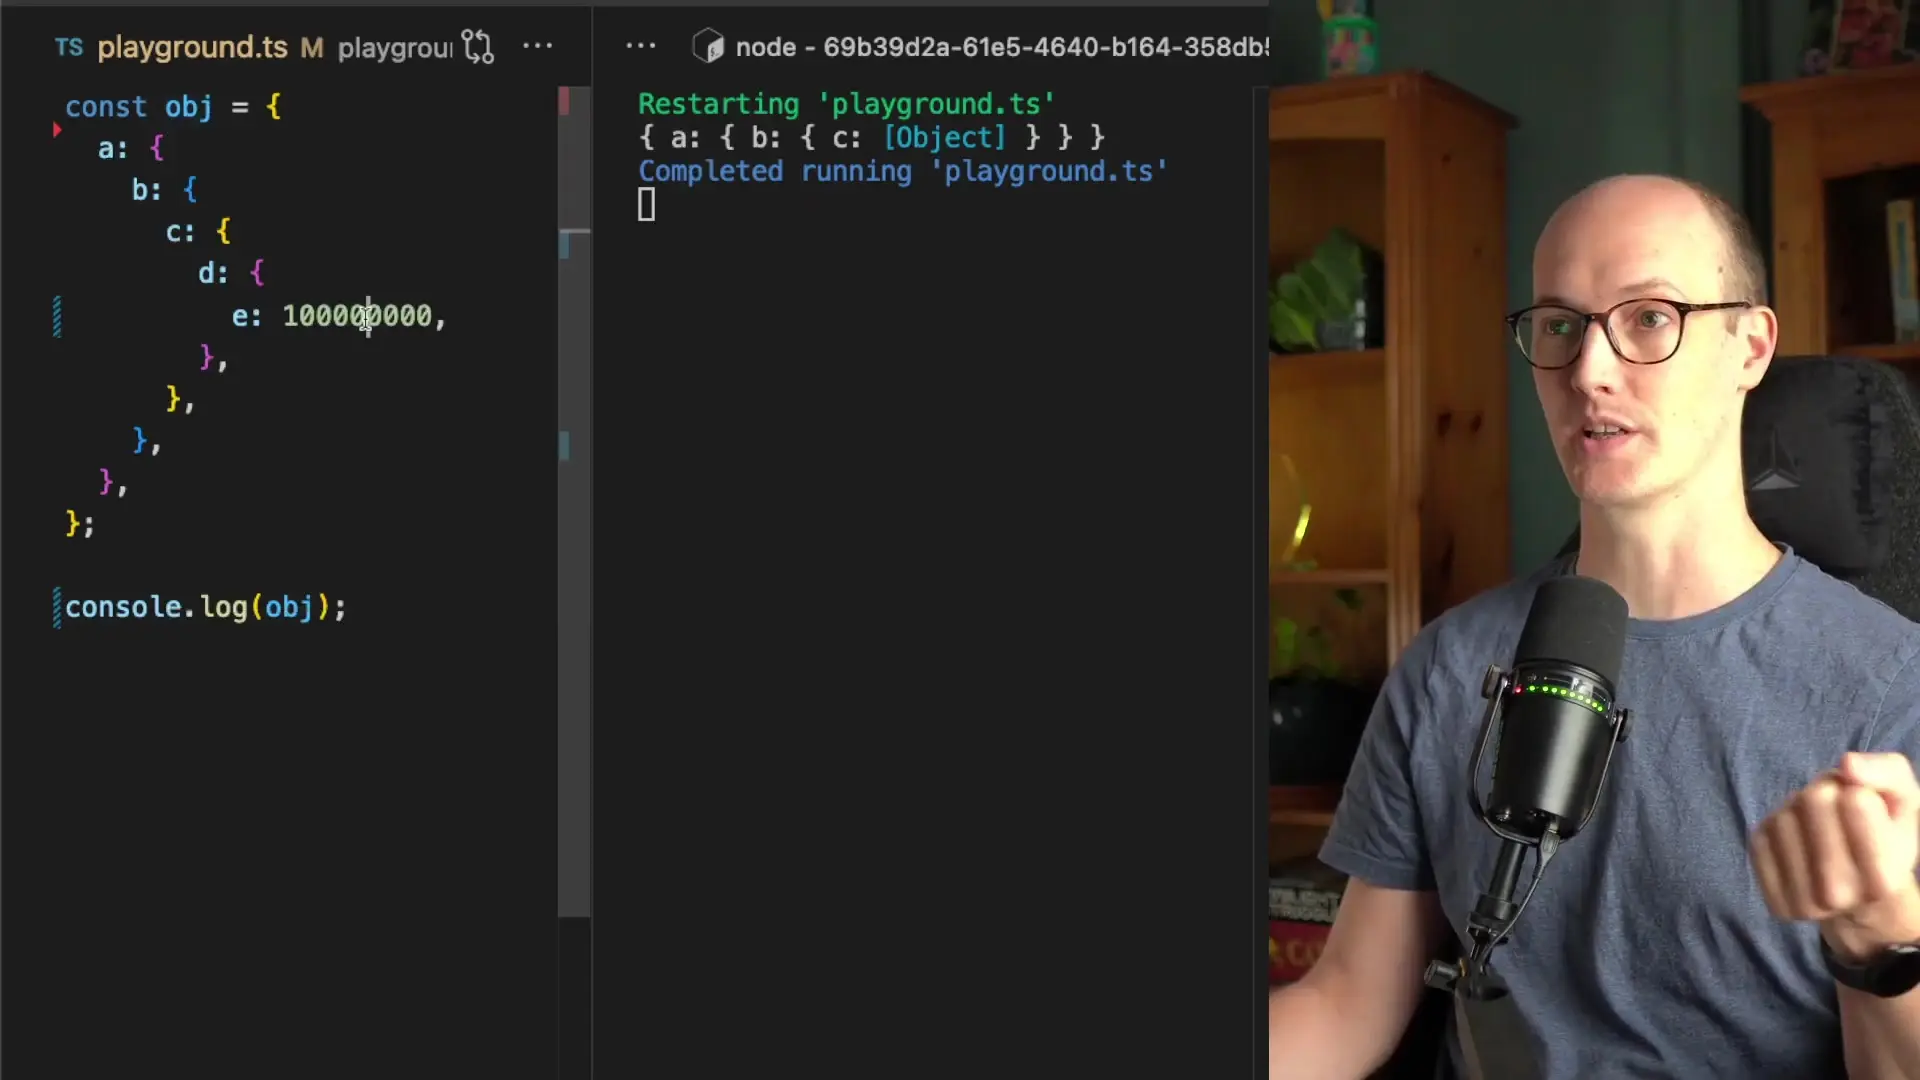
Let's start by understanding the limitation. When working with deeply nested objects, a standard console.log() call doesn't display the complete structure. By default, JavaScript only shows a few levels deep, which can be frustrating when trying to debug complex data structures.
const deepObject = {
  a: {
    b: {
      c: {
        d: {
          e: 123456789012345
        }
      }
    }
  }
};

console.log(deepObject); // Output will be truncatedAs you can see, when dealing with objects that have multiple nested levels, the standard logging method simply doesn't provide enough visibility into the deeper properties. This is where advanced console logging techniques become essential.
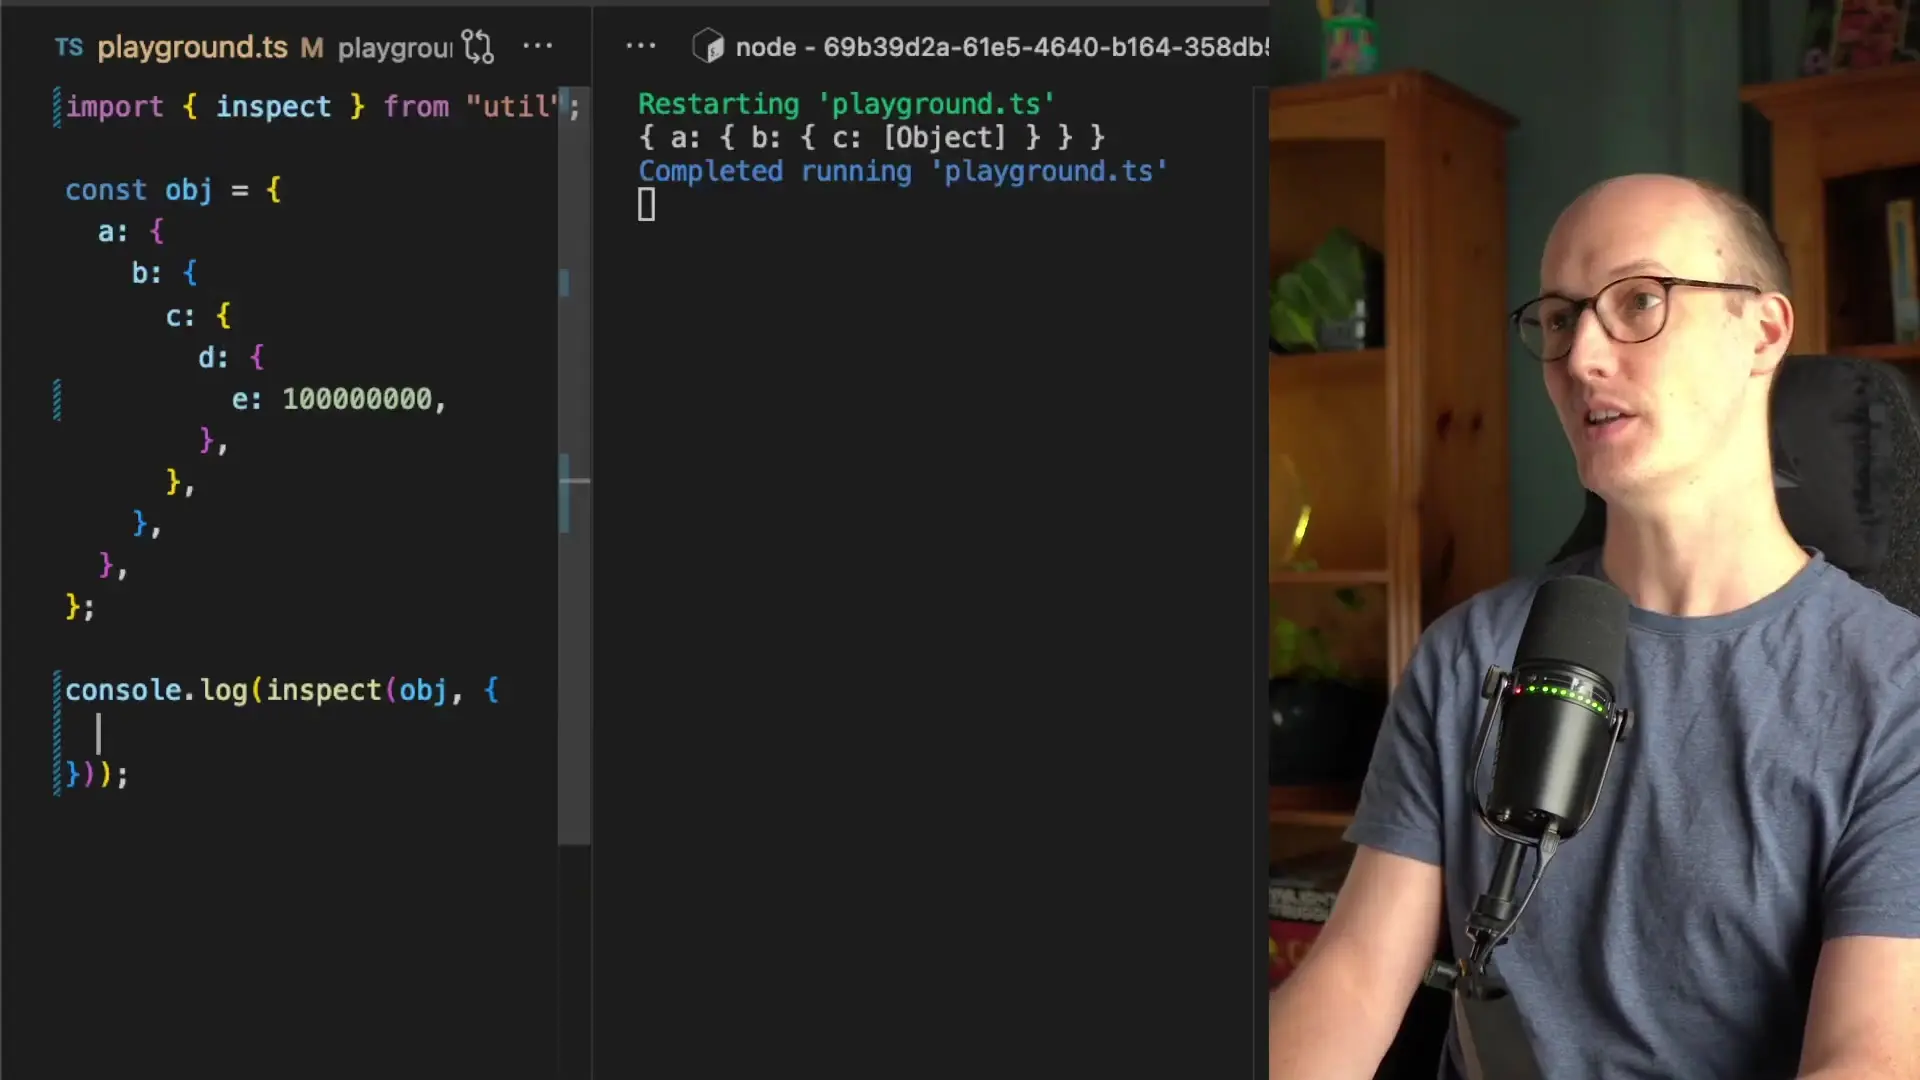
Solution 1: Using util.inspect for Advanced Logging
Node.js provides a powerful utility called 'inspect' from the 'util' module that gives you much more control over how objects are displayed in the console.
const { inspect } = require('util');

console.log(inspect(deepObject, { depth: 4 }));The inspect function accepts an options object as its second parameter, where you can specify how deep into the object structure you want to go. Setting the depth to 4 will show properties up to 4 levels deep, which is often sufficient for most debugging scenarios.
Customizing the Output with inspect Options
The util.inspect function offers several options to enhance your debugging experience:
- depth: Controls how many levels deep to display (use Infinity to show all levels)
- colors: Adds syntax highlighting to make the output more readable
- maxArrayLength: Controls how many array elements to display
- maxStringLength: Limits the length of displayed strings
- numericSeparator: Adds separators to large numbers for better readability
console.log(inspect(deepObject, {
  depth: Infinity,
  colors: true,
  numericSeparator: true
}));
Solution 2: Using console.dir for Advanced Logging
If you don't want to import the util module, JavaScript provides a built-in alternative: console.dir(). This method is specifically designed for displaying object properties in a more detailed way.
console.dir(deepObject, { depth: Infinity, colors: true });The console.dir() method accepts similar options to util.inspect and provides the same enhanced visualization capabilities without requiring an additional import. This makes it particularly useful in browser environments or when you want to keep your dependencies minimal.
Practical Advanced Console Logging Techniques
Now that we understand the basic tools, let's explore some practical advanced console logging techniques that you can incorporate into your debugging workflow:
1. Visualizing Complete Object Hierarchies
// For complete visibility into any object, no matter how deep
console.dir(complexObject, { depth: Infinity, colors: true });2. Improving Readability of Large Numbers
// Makes large numbers more readable with separators
const { inspect } = require('util');
console.log(inspect(financialData, {
  depth: 4,
  colors: true,
  numericSeparator: true
}));3. Creating Custom Logger Functions
// Create a reusable advanced logger
function advancedLog(obj, depth = 4) {
  console.dir(obj, {
    depth: depth,
    colors: true,
    numericSeparator: true
  });
}

// Now use it throughout your code
advancedLog(complexData);
advancedLog(userProfile, Infinity);4. Conditional Depth-Based Logging
// Log with different depths based on environment
const logDepth = process.env.NODE_ENV === 'development' ? Infinity : 2;
console.dir(userData, { depth: logDepth, colors: true });5. Focused Property Logging
// When you only need to see a specific nested property
function logNestedProperty(obj, path) {
  const parts = path.split('.');
  let current = obj;

  for (const part of parts) {
    current = current[part];
    if (current === undefined) return console.log(`Path ${path} not found`);
  }

  console.dir(current, { depth: Infinity, colors: true });
}

logNestedProperty(deepObject, 'a.b.c');When to Use Advanced Console Logging
Advanced console logging techniques are particularly valuable in the following scenarios:
- Debugging complex API responses with deeply nested data
- Inspecting configuration objects with multiple levels
- Analyzing large state objects in frontend applications
- Troubleshooting database query results with nested relations
- Examining complex DOM structures in browser environments
- Debugging nested JSON structures in Node.js applications
Conclusion
Mastering advanced console logging techniques can significantly improve your debugging efficiency when working with complex JavaScript objects. By using util.inspect or console.dir with appropriate options, you can visualize deeply nested structures that would otherwise be truncated by standard console.log() calls.
These techniques are especially valuable in modern JavaScript development where deeply nested objects are common in state management libraries, API responses, and configuration files. By incorporating these advanced logging methods into your debugging toolkit, you'll spend less time struggling to understand your data structures and more time solving actual problems.
Remember that effective debugging is about visibility, and these advanced console logging techniques give you the enhanced visibility you need when working with complex JavaScript applications.
Let's Watch!
7 Advanced Console Logging Techniques Every JavaScript Developer Should Know
Ready to enhance your neural network?
Access our quantum knowledge cores and upgrade your programming abilities.
Initialize Training Sequence