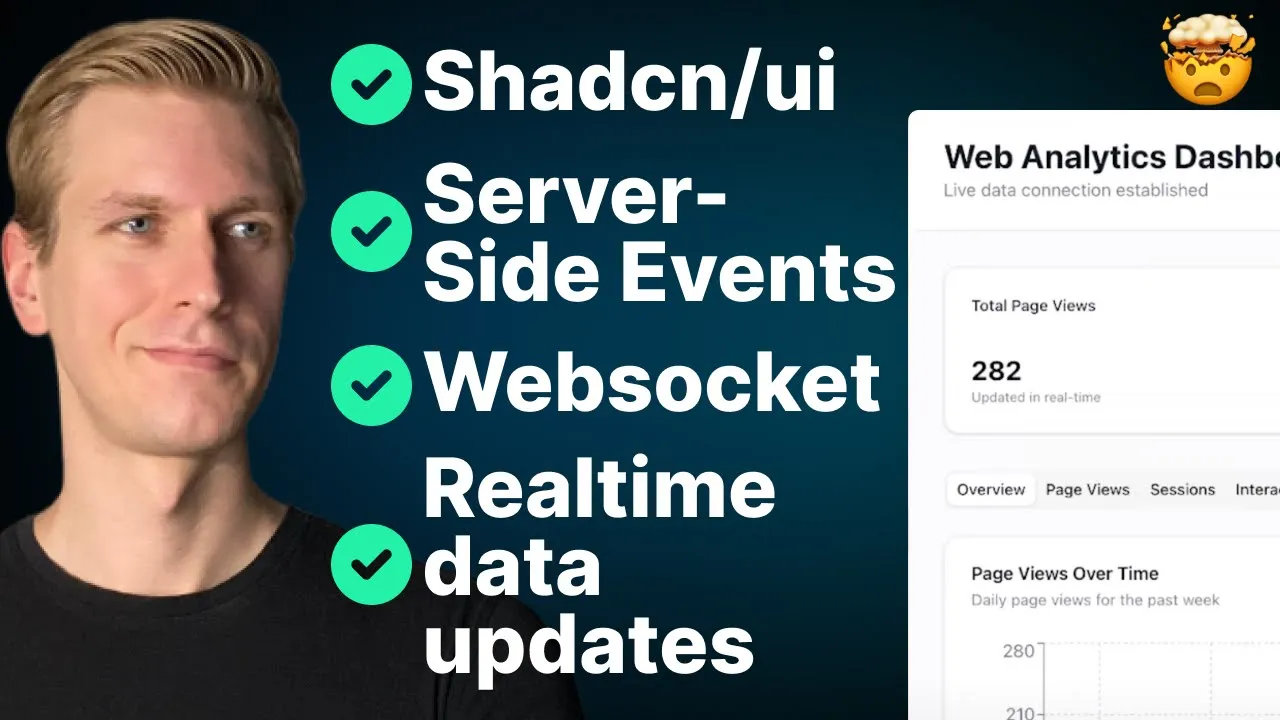
Build Real-Time Next.js Dashboards: The Ultimate Tech Stack Guide with ShadCN UI & WebSockets
Eleanor Park
Developer Advocate
Building real-time analytical dashboards has become significantly easier with modern web development tools and frameworks. If your application processes large amounts of data that needs continuous monitoring, Next.js provides an excellent foundation for creating responsive, real-time dashboards. In this comprehensive guide, we'll explore the optimal tech stack for building powerful analytical dashboards with Next.js, from UI components to data processing architecture.
Why Next.js for Real-Time Dashboards?
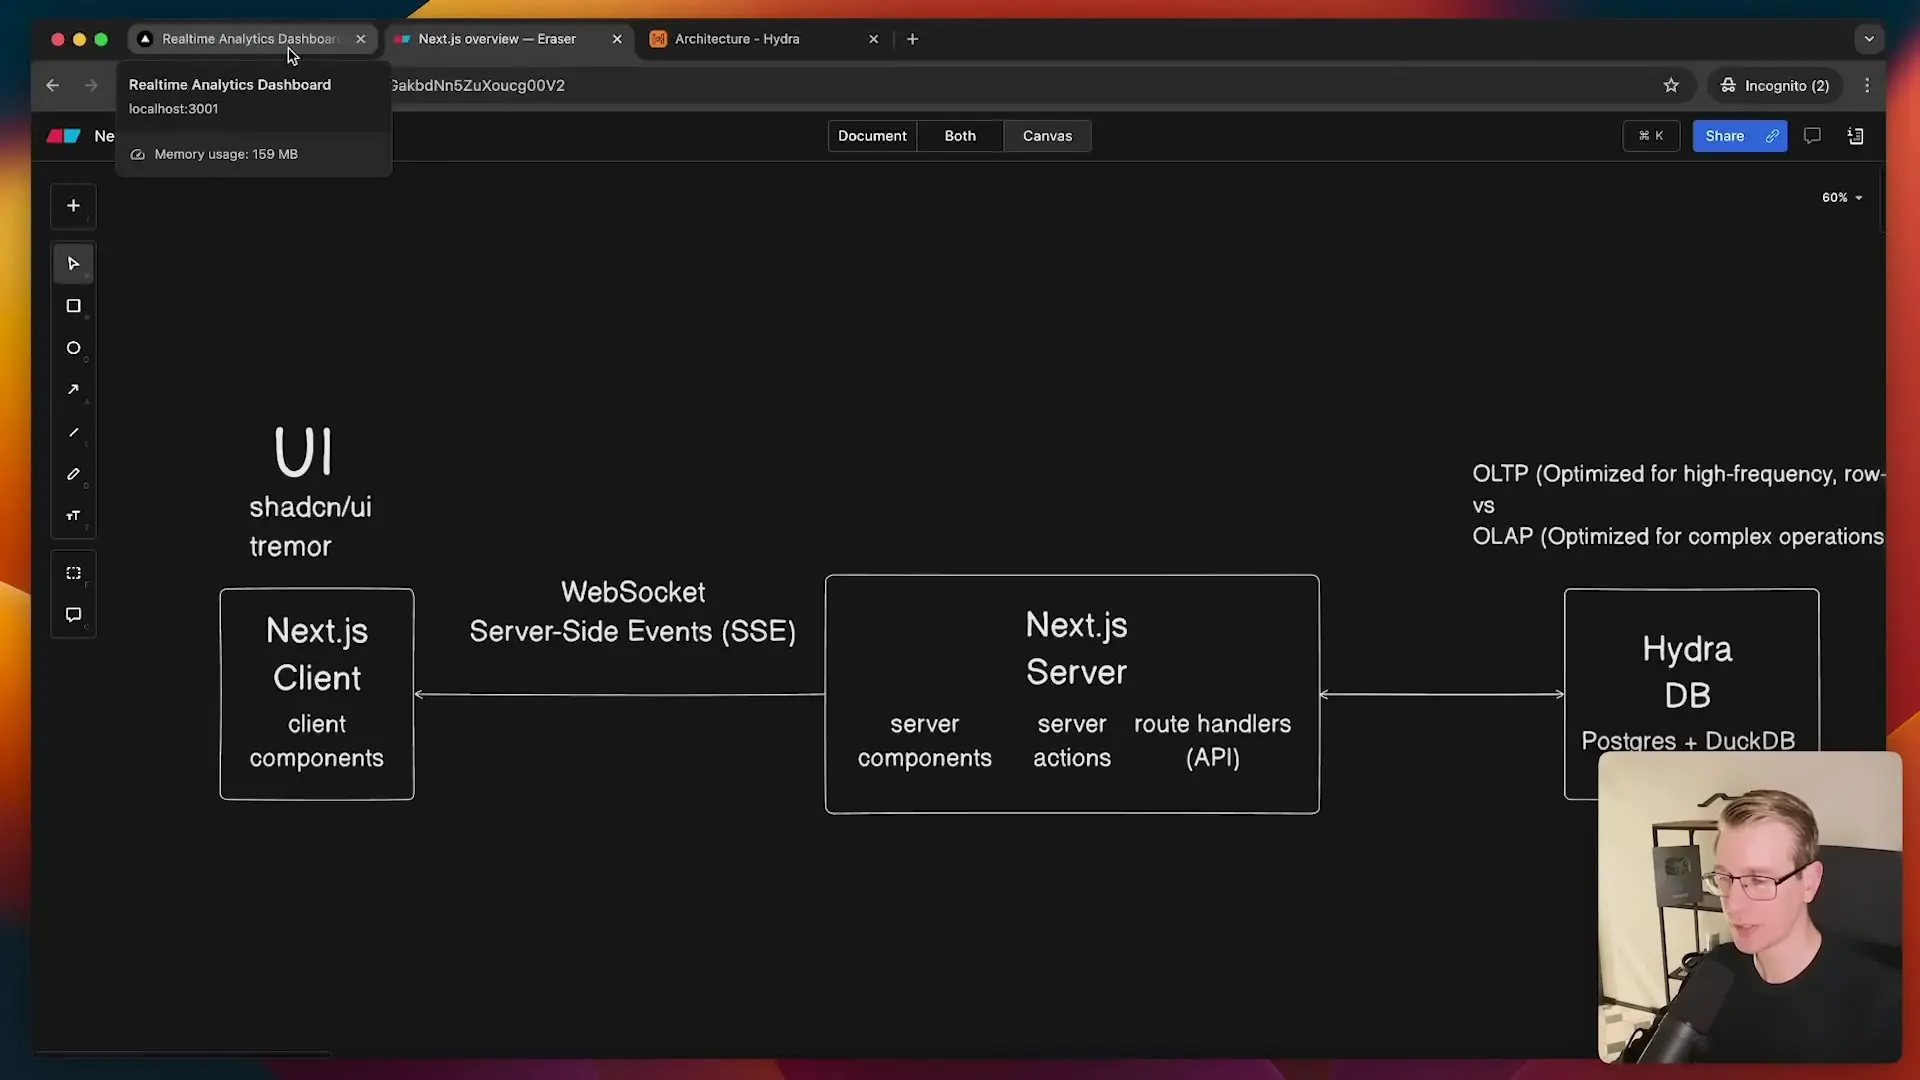
Next.js stands out as an ideal framework for dashboard development due to its full-stack capabilities. With both client-side and server-side rendering in one cohesive framework, you can build complete applications without needing separate backend services. This simplifies the architecture considerably, allowing you to focus on creating a responsive and data-rich user experience.
The framework's built-in API routes make it straightforward to implement real-time data connections, whether you're using WebSockets, Server-Sent Events, or other communication protocols. This integrated approach eliminates many of the complexities traditionally associated with building real-time applications.
Choosing the Right UI Component Library
When building dashboards, you'll need a robust UI component library to handle the various charts, graphs, and interactive elements. Two excellent options stand out in the Next.js ecosystem:
ShadCN UI: The Modern Approach
ShadCN UI has gained tremendous popularity in the Next.js community for several compelling reasons. Unlike traditional component libraries, ShadCN takes a unique approach by giving you direct access to the underlying code. Instead of importing pre-built components, you copy the component code directly into your codebase, allowing for unlimited customization.
- Built on Tailwind CSS for consistent styling
- Provides accessible, unstyled components that you can customize
- No abstraction layer, giving you complete control over the implementation
- Excellent accessibility features built-in (keyboard navigation, focus management)
- Recently joined Vercel, ensuring continued development and support
Tremor: The Dashboard Specialist
Tremor is another excellent option specifically designed for building analytical dashboards and data visualization interfaces. It provides ready-made components for charts, metrics, and KPI displays that integrate seamlessly with Next.js applications.
- Specialized components for data visualization
- Pre-built blocks and templates for common dashboard patterns
- Tailwind CSS integration
- Recently joined Vercel, indicating strong future support
- Excellent documentation with code examples
Both libraries excel at handling the complex UI requirements of dashboards while providing important accessibility features like focus trapping in modals, keyboard navigation, and proper ARIA attributes—details you don't want to implement from scratch.
Real-Time Communication Protocols
For a dashboard to display real-time data, you need an efficient communication channel between your server and client. There are two primary options to consider:
WebSockets: Bidirectional Communication
WebSockets establish a persistent, two-way connection between the client and server, allowing data to flow in both directions. This makes them highly versatile for applications that require client-to-server communication in addition to server updates.
- Bidirectional communication
- Real-time data transfer with minimal latency
- Suitable for interactive dashboards where users can trigger actions
- More complex to implement but offers greater flexibility
- Excellent for chat applications, collaborative tools, and interactive dashboards
// Basic WebSocket client setup in Next.js
import { useEffect, useState } from 'react';

function DashboardComponent() {
  const [data, setData] = useState([]);

  useEffect(() => {
    const ws = new WebSocket('wss://your-nextjs-server/api/websocket');

    ws.onopen = () => {
      console.log('Connected to WebSocket server');
    };

    ws.onmessage = (event) => {
      const newData = JSON.parse(event.data);
      setData(prev => [...prev, newData]);
    };

    return () => {
      ws.close();
    };
  }, []);

  return (
    <div>
      {/* Render dashboard with data */}
    </div>
  );
}Server-Sent Events (SSE): Simplified Streaming
Server-Sent Events provide a simpler alternative when you only need server-to-client communication—which is often the case for analytical dashboards. SSE establishes a unidirectional channel where the server can push updates to the client as they occur.
- Simpler implementation than WebSockets
- Built on HTTP protocol, making it easier to work with
- Automatic reconnection if the connection is lost
- One-way communication (server to client only)
- Perfect for dashboards that only need to display updated data
// Server-side implementation in Next.js API route
export default function handler(req, res) {
  res.setHeader('Content-Type', 'text/event-stream');
  res.setHeader('Cache-Control', 'no-cache');
  res.setHeader('Connection', 'keep-alive');

  // Send initial data
  res.write(`data: ${JSON.stringify({ initialData: true })}

`);

  // Set up interval to send new data
  const intervalId = setInterval(() => {
    const newData = generateNewData(); // Your data generation function
    res.write(`data: ${JSON.stringify(newData)}

`);
  }, 5000);

  // Clean up on close
  res.on('close', () => {
    clearInterval(intervalId);
    res.end();
  });
}// Client-side implementation
import { useEffect, useState } from 'react';
function AnalyticsDashboard() {
const [metrics, setMetrics] = useState([]);
useEffect(() => {
const eventSource = new EventSource('/api/analytics-stream');
eventSource.onmessage = (event) => {
const newData = JSON.parse(event.data);
setMetrics(prev => [...prev, newData]);
};
return () => {
eventSource.close();
};
}, []);
return (
<div className="dashboard-container">
{/* Render your dashboard components with metrics data */}
</div>
);
}For most analytical dashboards, Server-Sent Events provide the perfect balance of simplicity and functionality, as they're primarily focused on displaying data rather than sending user actions back to the server.
Database Considerations: OLTP vs. OLAP
The database is arguably the most critical component of your analytics dashboard stack. The choice between different database technologies depends largely on the types of queries your application will perform.
OLTP (Online Transaction Processing)
OLTP databases are optimized for handling many small, simple transactions quickly. These are the databases most developers are familiar with for typical web applications.
- Optimized for quick, simple queries affecting single records
- Excellent for CRUD operations (Create, Read, Update, Delete)
- Examples: PostgreSQL, MySQL, SQLite for simpler applications
- Best for user management, content management, e-commerce transactions
- Not ideal for complex analytical queries across large datasets
OLAP (Online Analytical Processing)
OLAP databases are specifically designed for complex analytical queries that aggregate and analyze large volumes of data. These are essential for building performant analytical dashboards.
- Optimized for complex queries across multiple records
- Excellent for aggregations, grouping, and time-series analysis
- Examples: ClickHouse, DuckDB, Snowflake, BigQuery
- Designed for data warehousing and business intelligence
- Can handle queries like "average session duration by country over the last 30 days"
For many real-time dashboard applications, a hybrid approach works best. You might use an OLTP database like PostgreSQL for storing raw event data as it comes in, then use an OLAP system for the analytical queries that power your dashboard visualizations.
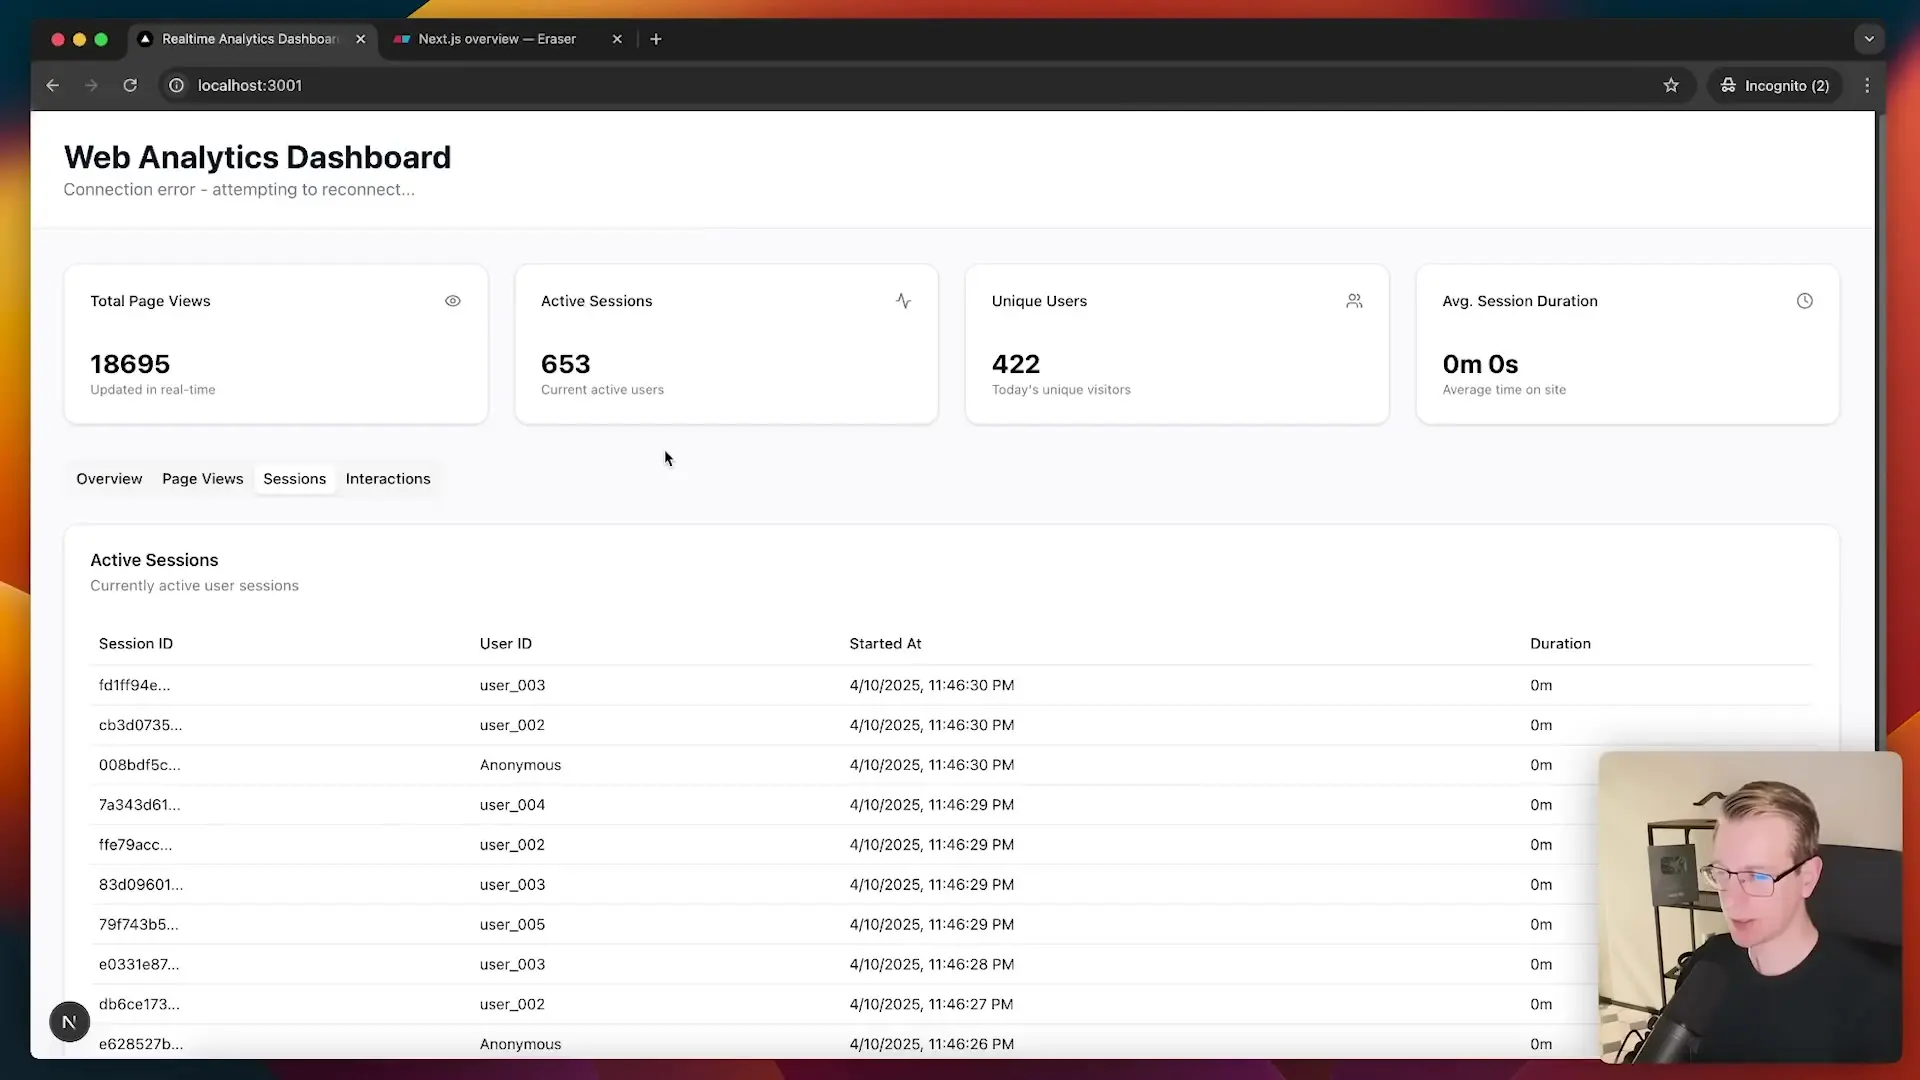
Putting It All Together: Building a Real-Time Dashboard
Now that we've covered the key components, let's outline how they fit together in a complete Next.js dashboard application:
- Set up a Next.js project with TypeScript for type safety
- Install and configure ShadCN UI or Tremor for your dashboard components
- Implement Server-Sent Events for real-time data streaming
- Set up your database architecture (OLTP for raw data, OLAP for analytics)
- Create API routes to handle data queries and transformations
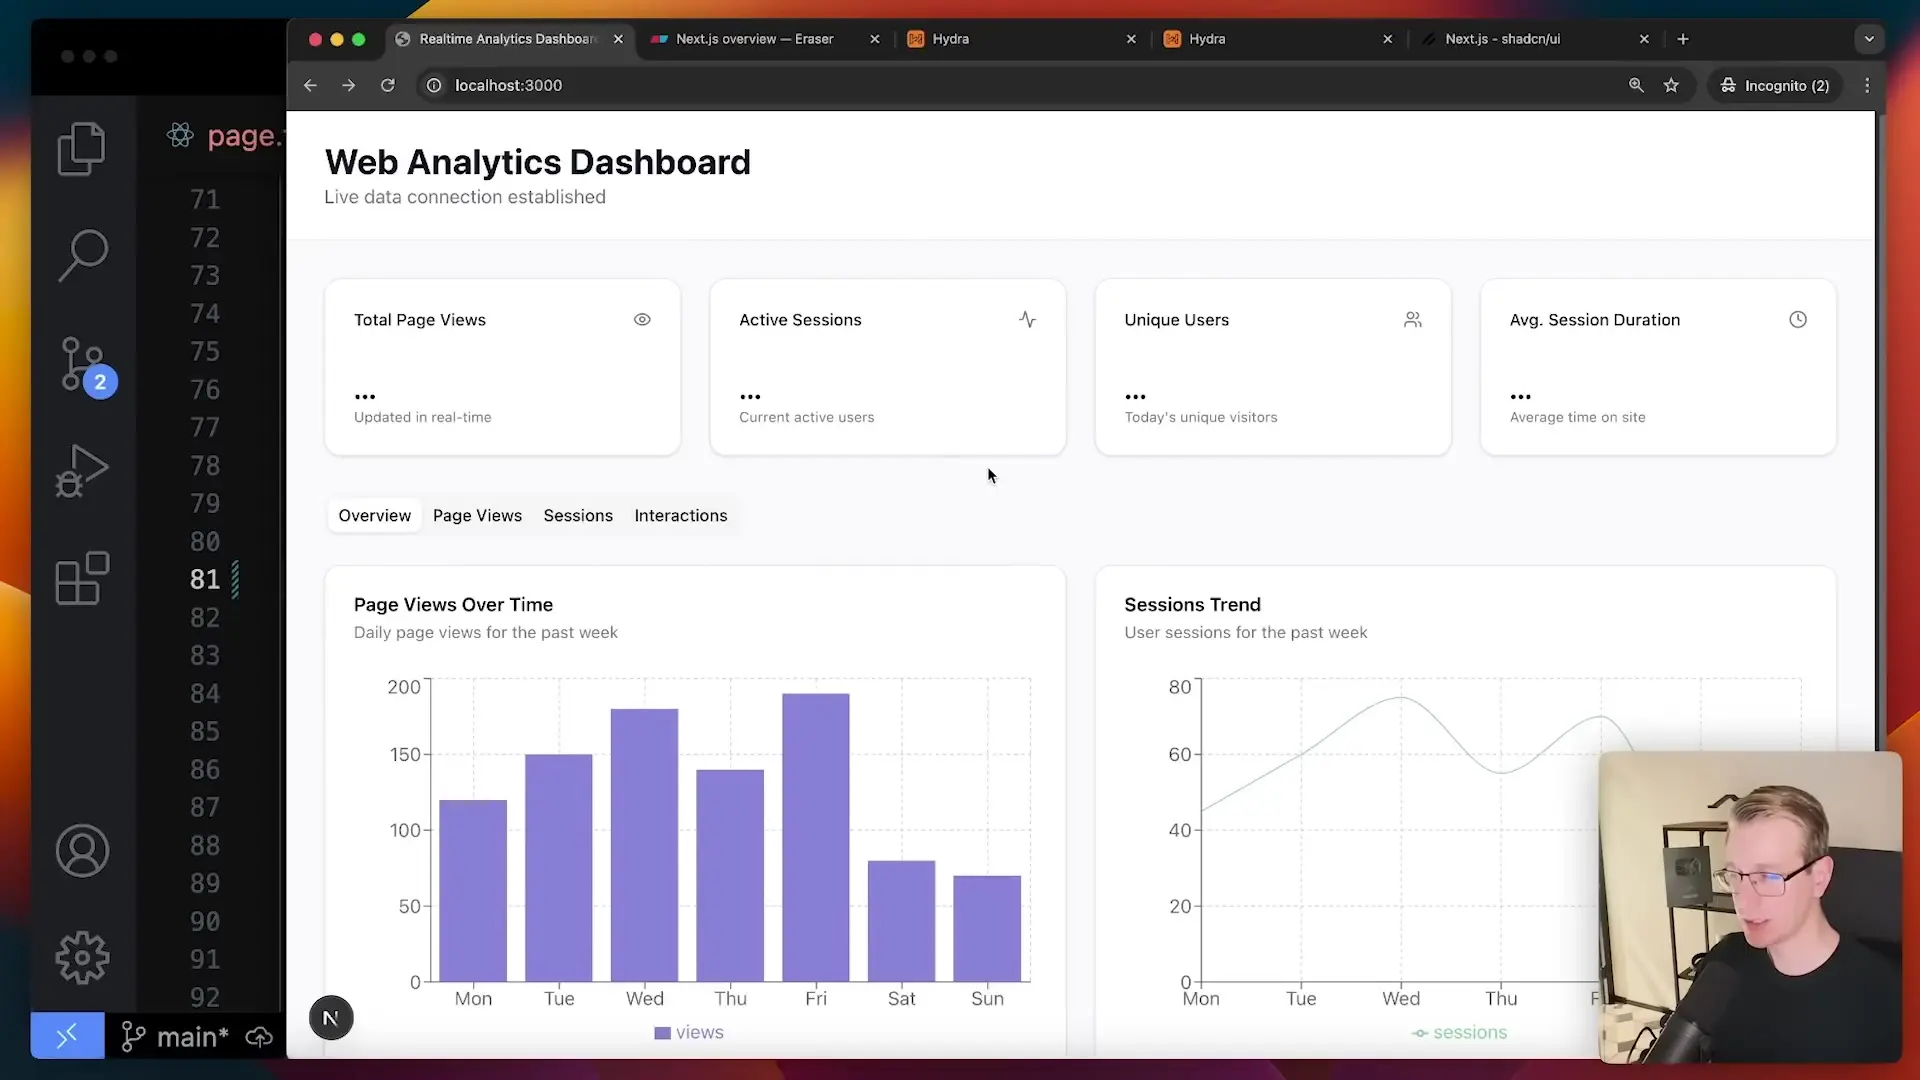
- Build your dashboard UI with appropriate charts and metrics displays
- Implement data refresh strategies (real-time updates + periodic polling as backup)
Example Project Structure
my-nextjs-dashboard/
├── components/
│   ├── ui/            # ShadCN UI components
│   ├── charts/        # Chart components
│   └── dashboard/     # Dashboard-specific components
├── lib/
│   ├── db/           # Database connection utilities
│   └── utils/        # Helper functions
├── pages/
│   ├── api/
│   │   ├── events.js  # SSE endpoint
│   │   └── data.js    # Data fetching endpoints
│   ├── _app.js
│   ├── index.js
│   └── dashboard.js   # Main dashboard page
└── public/
└── assets/ # Static assetsPerformance Optimization Tips
Real-time dashboards can become performance bottlenecks if not properly optimized. Here are some key strategies to keep your Next.js dashboard running smoothly:
- Implement data windowing to limit the amount of data displayed at once
- Use React's memo and useMemo to prevent unnecessary re-renders
- Consider using WebWorkers for data processing that might block the main thread
- Implement proper database indexing for frequently queried fields
- Add caching layers for queries that don't need real-time updates
- Use efficient data structures for storing and manipulating time-series data
- Consider data downsampling for historical data to improve chart rendering performance
Conclusion
Building real-time analytical dashboards with Next.js has never been easier thanks to modern UI libraries like ShadCN UI and Tremor, efficient communication protocols like Server-Sent Events, and the right database architecture. By understanding the differences between OLTP and OLAP database systems and choosing the right tools for your specific analytics needs, you can create powerful, responsive dashboards that provide valuable insights into your application's data.
The key to success is matching your technology choices to your specific requirements. For most analytical dashboards, a combination of ShadCN UI for the interface, Server-Sent Events for real-time updates, and a properly designed database architecture will provide an excellent foundation for building powerful data visualization tools that can scale with your application's needs.
Let's Watch!
Build Real-Time Next.js Dashboards: The Ultimate Tech Stack Guide for 2023
Ready to enhance your neural network?
Access our quantum knowledge cores and upgrade your programming abilities.
Initialize Training Sequence