12 Essential Logging Best Practices That Will Save You From 3AM Debugging Nightmares
Priya Narayan
Systems Architect
Everyone thinks they understand logging until they're staring at a production issue at 3:00 AM, with logs that have no context, no structure, and they're sifting through walls of text looking for that needle in a haystack. Let's explore some essential logging best practices that will help you avoid these nightmares and build more maintainable systems.
Have a Clear Logging Strategy
Don't just throw log statements everywhere hoping something useful will stick. Before writing a single log statement, ask yourself these key questions:
- What are your application's main goals?
- Which critical operations need monitoring?
- What KPIs actually matter to your business?
- What information would future you need when debugging at 3AM?
When it comes to error logging, your objective isn't just to scream 'Hey, something broke!' Your goal is to provide enough context to fix the problem. Think about what the future you wants when debugging in the middle of the night.
It's often better to start by over-logging and then trim back. It's far easier to remove noise than to add missing information when you're already in production. Take time to periodically review your logging strategy as well—what's useful and what's just noise? The best logging strategy isn't about capturing everything; it's about capturing the right things.
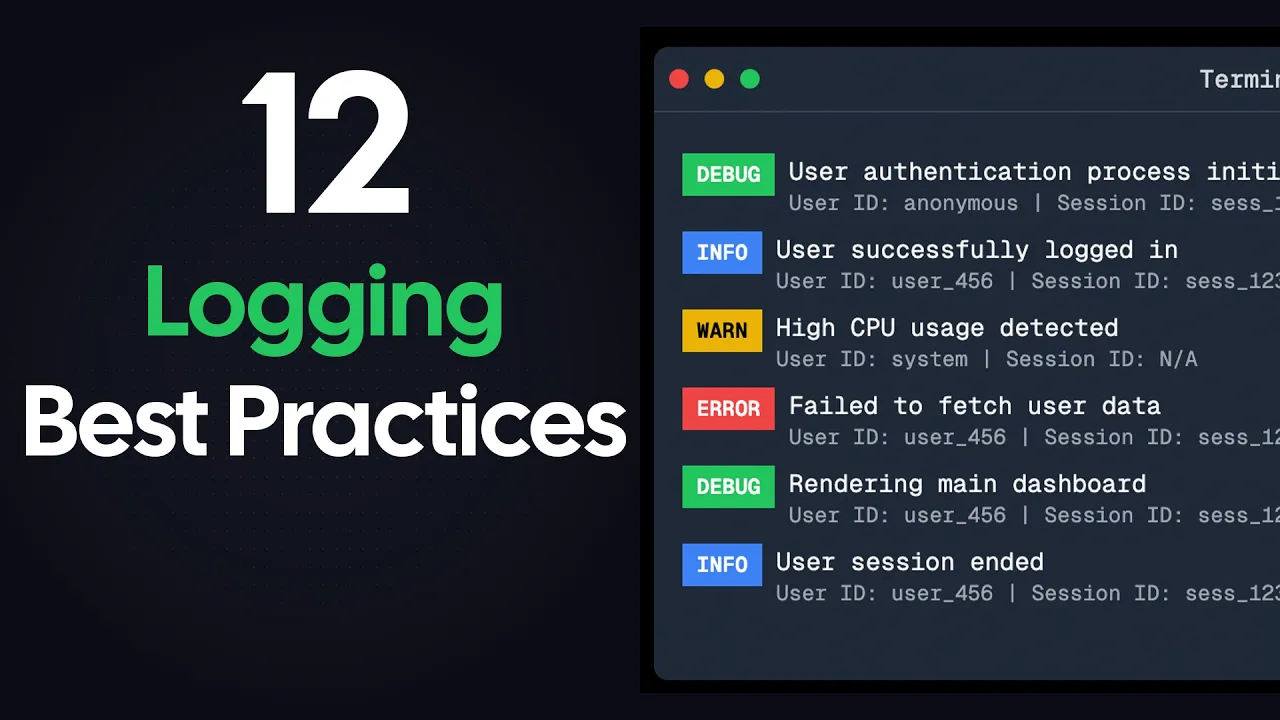
Understanding Log Levels
Log levels help categorize information by importance and urgency. Let's break down the four common levels:
- INFO: Your business-as-usual level. Think successful user logins, important transactions—the stuff you actually care about tracking. Example: 'User completed checkout, order #12345'
- WARNING: Consider this your early warning system. Something's not quite right, but your house isn't on fire yet. Example: 'Payment processing taking longer than usual'
- ERROR: Now we're talking about real problems. Failed payments, crashes, or service disruptions. Example: 'Database connection failed'
- FATAL: Hopefully you never see this. This is the everything's-gone-wrong level where either part of your stack or the entire application has crashed. Example: 'System out of memory, shutting down'
In production, most applications default to the INFO level to keep things clean. However—and this is crucial—you need to plan to increase detail when hunting down bugs. This is where you should implement the ability to log at increased verbosity temporarily while investigating issues, with a way to manage that verbosity when needed.
Structured Logging: The Game Changer
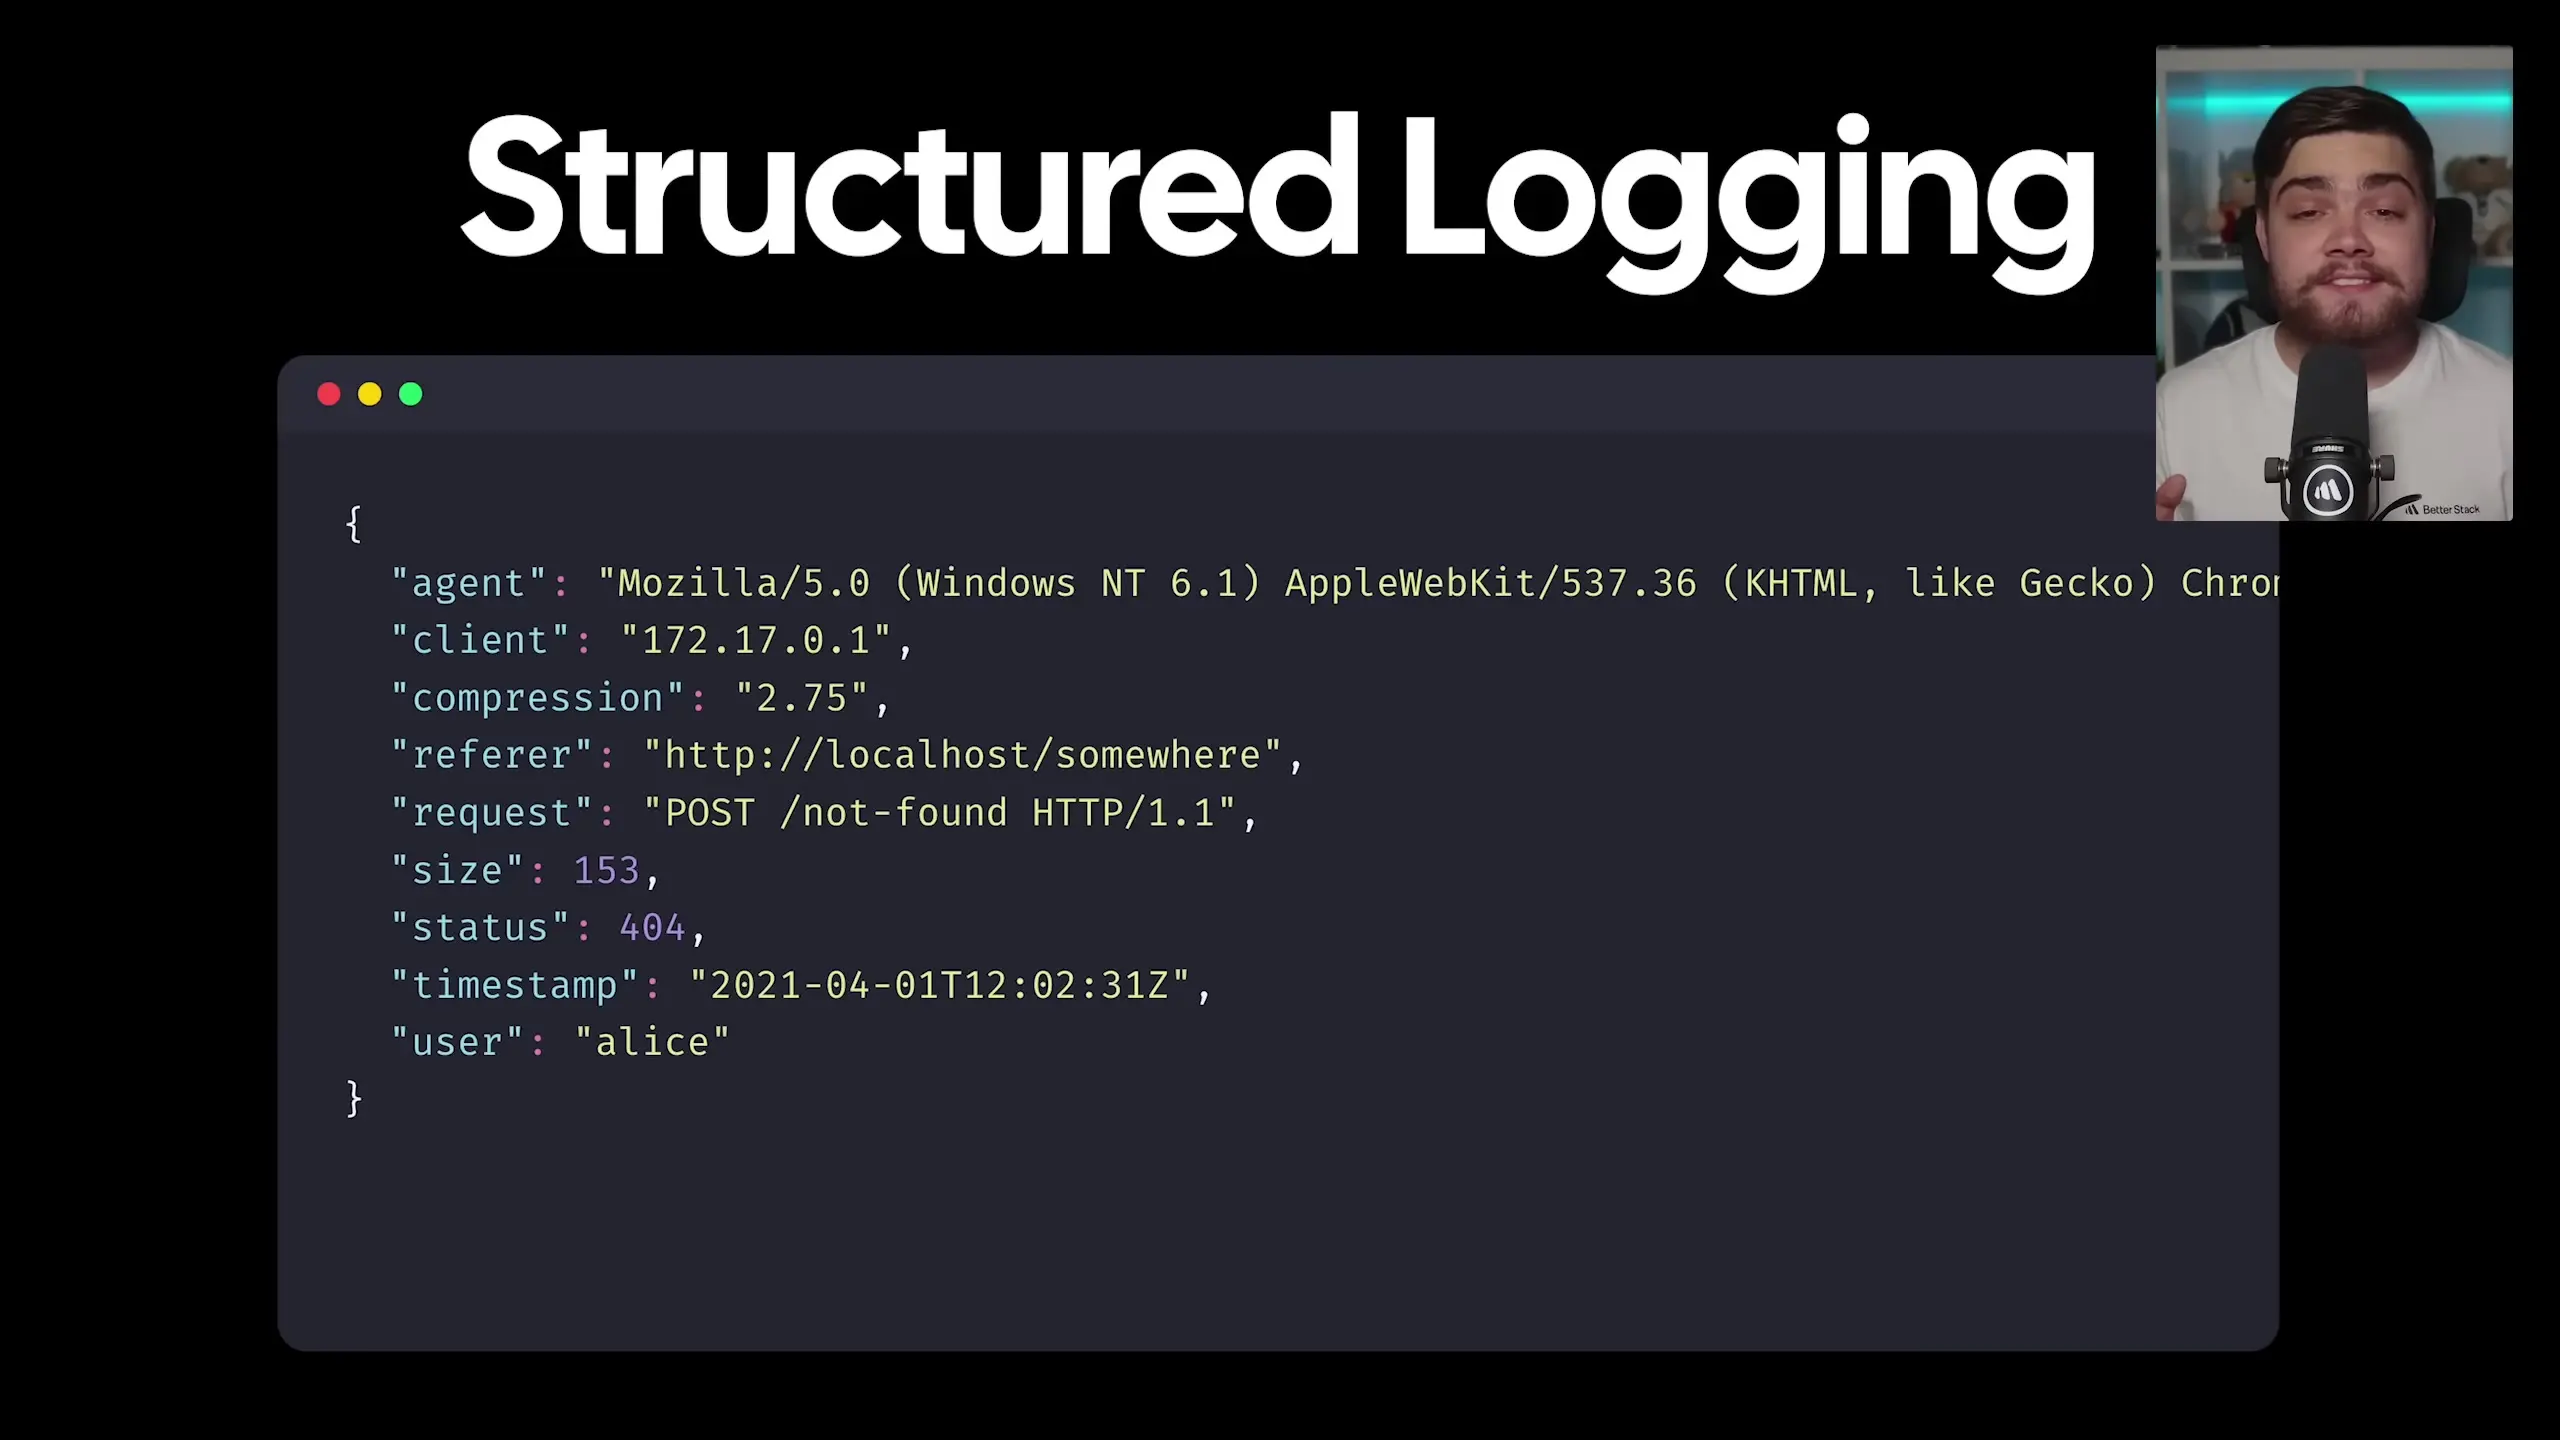
Basic unstructured logging creates a mess. Sure, humans can read it, but try getting a machine to make sense of that! Structured logging changes everything by ensuring every piece of information has its own field.
This isn't just prettier—it's more powerful. Now you can filter, search, and analyze your logs with ease. Want to find all timeout errors? Need to check how many errors happened last Tuesday? With structured logging, these tasks become trivial.
{
  "timestamp": "2023-06-15T15:23:45.231Z",
  "level": "ERROR",
  "message": "Payment processing failed",
  "userId": "user-123",
  "orderId": "ord-456",
  "errorCode": "TIMEOUT",
  "service": "payment-gateway",
  "duration": 5023
}Modern logging frameworks can handle structured logging for you. There are excellent options for every programming language. If you're using a service that doesn't support structured logging, tools like Vector can transform your logs into parsable JSON.
Remember: If your logs aren't structured, you're essentially just writing very expensive text files.
What to Include in Your Logs
A log entry saying "Something's wrong" is technically true but practically useless. A better version would include the who, what, where, and why all in one place. When you need to debug broken logins, you'll want the user ID, location, device info, and even how many attempts they made.
Here's a list of things to capture in every log entry:
- Request IDs for tracing requests across microservices
- User IDs for user session context (when appropriate)
- System state data like database or cache status
- Full error context including stack traces when relevant
- Timestamp with timezone information
- Service or component name
- Operation being performed
Think of your logs as your system's black box recorder. Make them detailed enough that you can replay and understand any scenario that happened—not just know that something occurred.
Log Sampling: Keeping Costs Under Control
If you're running a high-traffic system, you might be generating hundreds of gigabytes or even terabytes of logs every day. At that scale, storing every single log is expensive and mostly unnecessary. This is where log sampling comes in.
Instead of storing every log, you store a representative sample. It's like a poll—you don't need to ask every person, just a good sample. For example, your authentication service might log every login attempt but with a 20% sampling rate. Out of 10 identical login events, you'd only store two.
The real power comes with selective sampling:
- Keep all error logs but sample success logs
- Sample more aggressively for high-traffic endpoints
- Maintain full logs for critical business paths
Logging frameworks or observability tools like OpenTelemetry offer built-in sampling capabilities. This simple change can cut your logging costs by 80% or more while still giving you all the insights you need. Just remember to implement sampling early—don't wait until your logging costs spike.
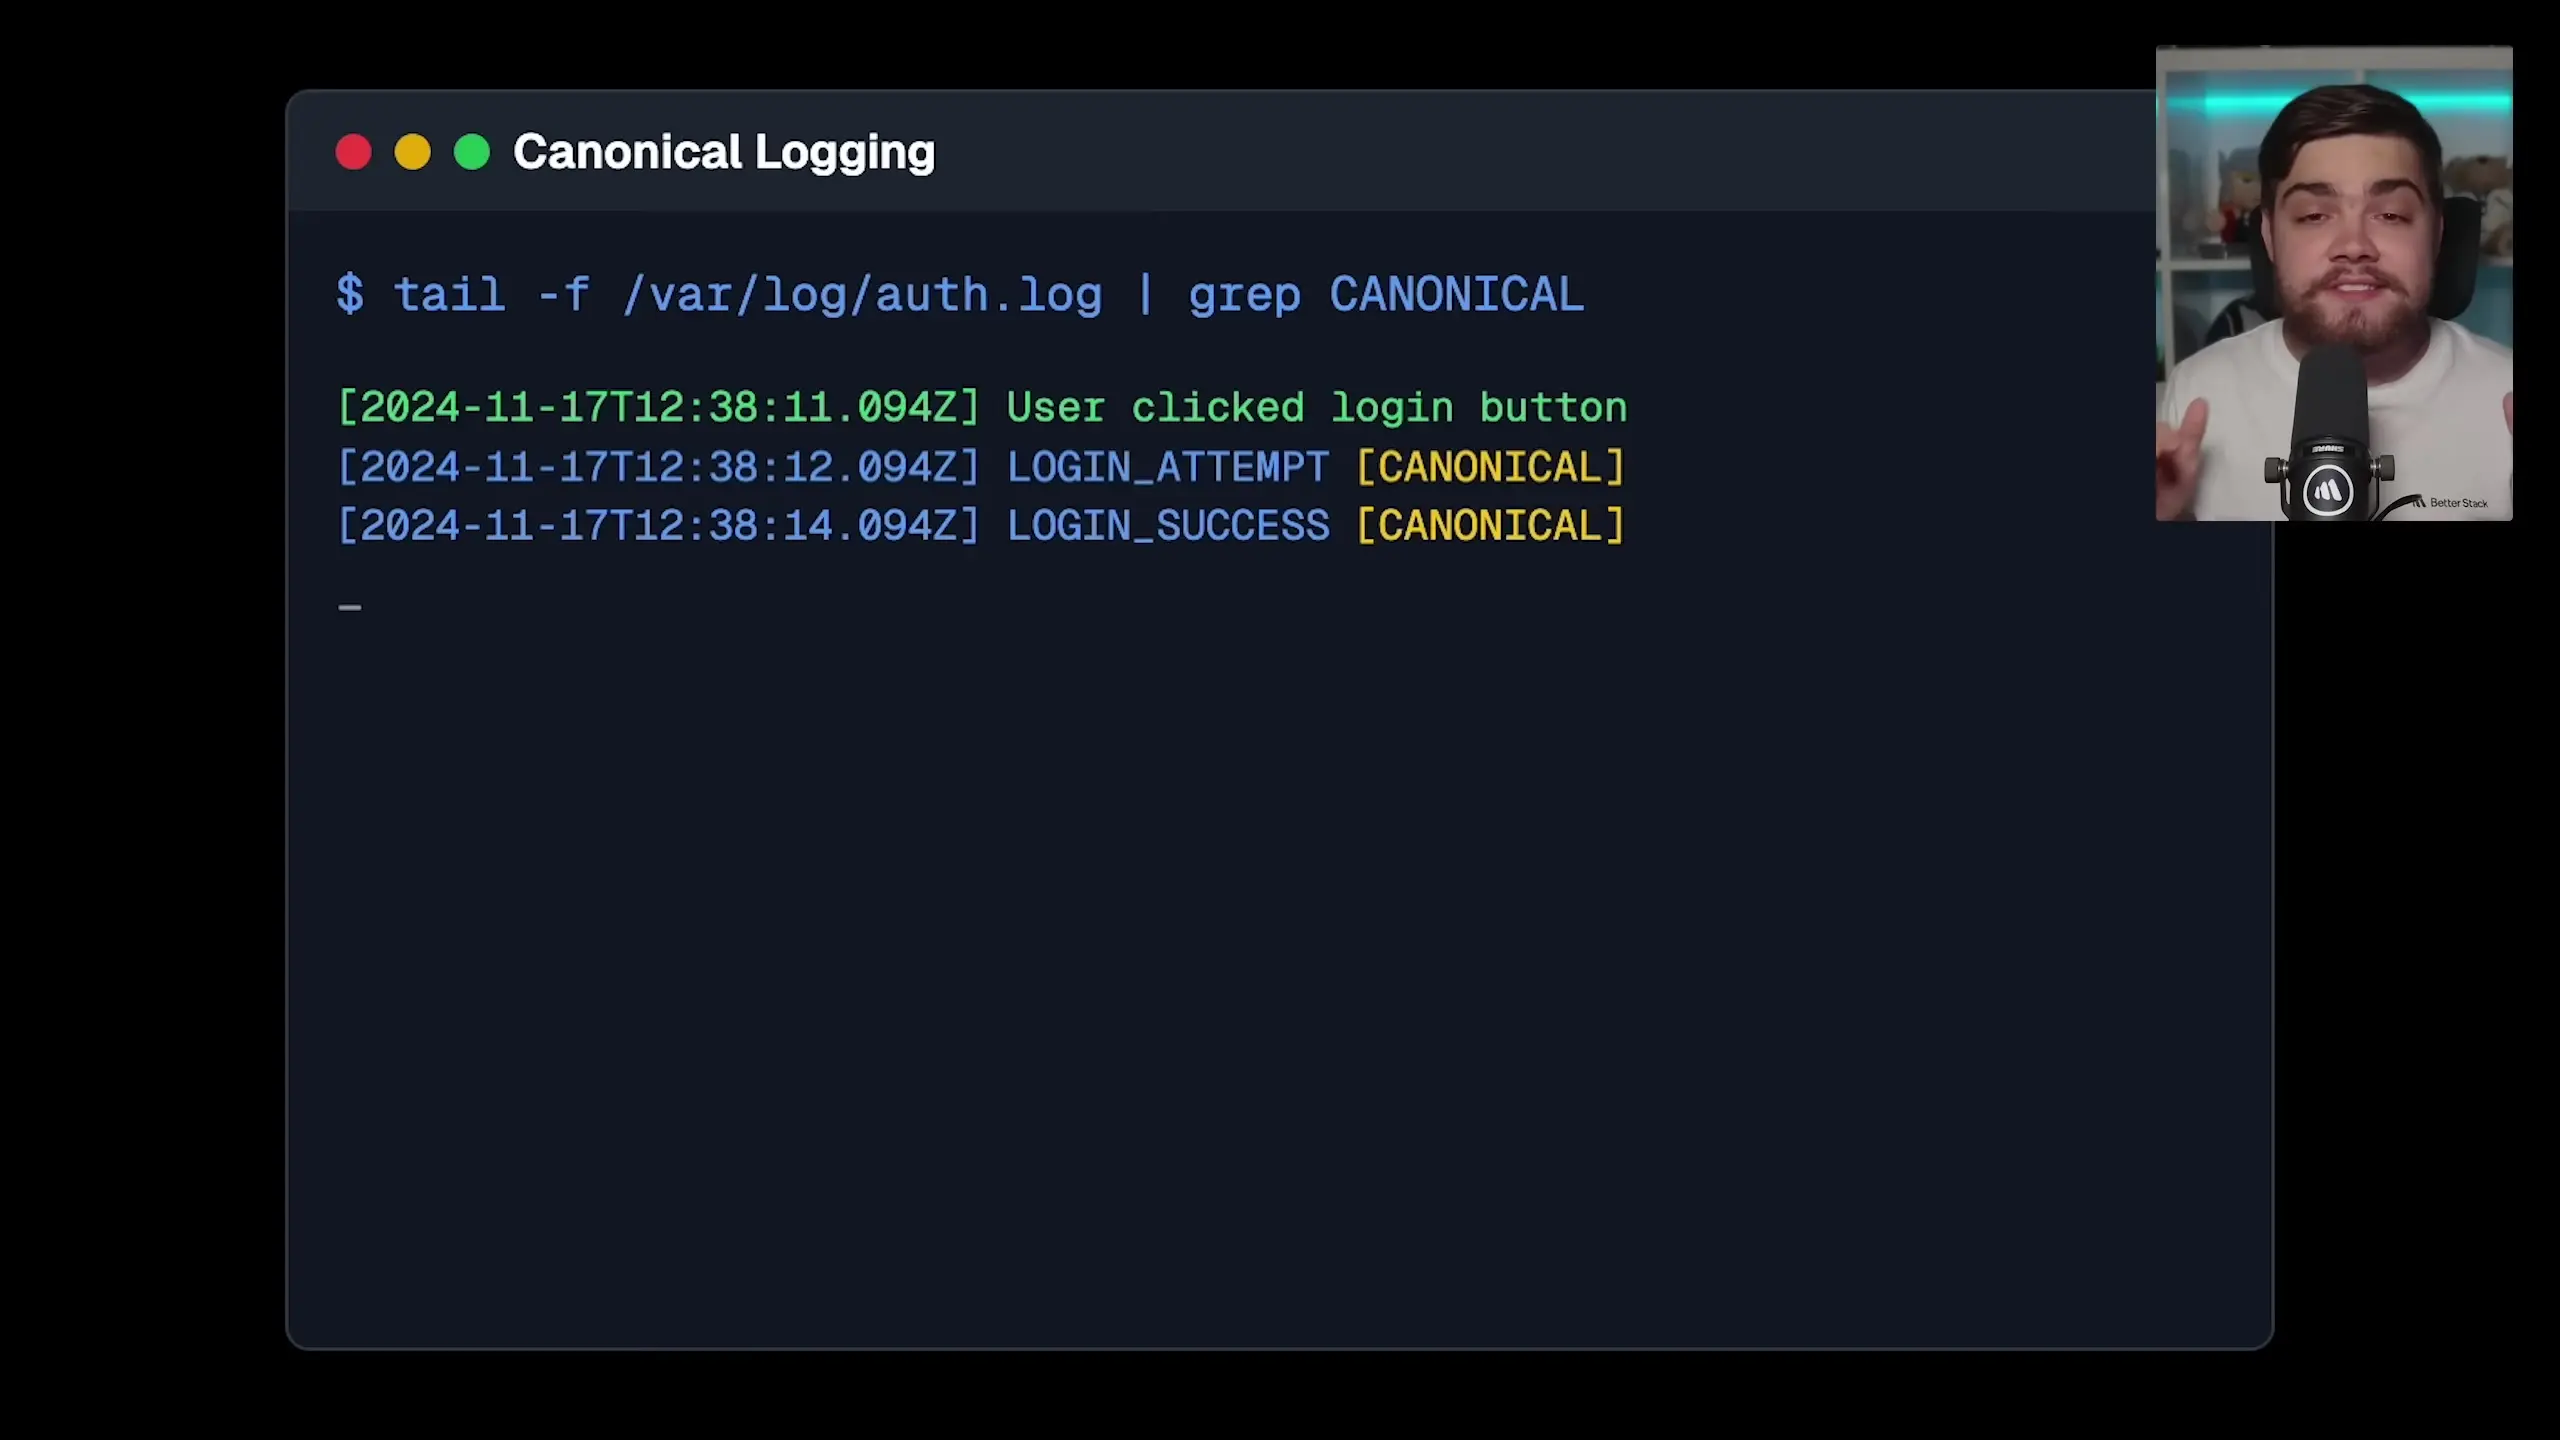
Canonical Log Lines and Distributed Tracing
When you're first starting out, you might log things as they happen: user clicked login button, checking credentials, login successful. The problem is when something goes wrong, you're stuck playing detective, jumping between different log entries trying to piece together what happened.
Canonical log lines solve this by creating a single log entry that tells the whole story. It's like a movie summary instead of watching all the scenes separately. For example, at the end of every request, create one log entry that captures everything important: what the user tried to do, who they were, what went wrong, how long it took, and even how much time was spent in the database.
{
  "timestamp": "2023-06-15T15:23:45.231Z",
  "level": "INFO",
  "message": "Checkout process completed",
  "userId": "user-123",
  "cartItems": 5,
  "totalAmount": 89.95,
  "paymentMethod": "credit-card",
  "duration": 1250,
  "databaseTime": 320,
  "paymentGatewayTime": 850,
  "userCountry": "US",
  "userDevice": "mobile-ios"
}An even better approach is to utilize distributed tracing with tools like OpenTelemetry. Traces allow you to maintain the entire journey of a request across all your services, seeing each individual step as a span but having an easy way to link them as one full request.
Centralized Logging: Bringing Everything Together
What's worse than having no logs? Having logs everywhere! Imagine running a modern application with a web server, database, cache, authentication service, and a dozen other microservices—each generating logs in different places. When an issue arises, checking logs across 10 different services is a nightmare.
This is why we aggregate and centralize logs. When you funnel all your logs into one place, you can:
- Search across everything at once
- See how problems in one service impacted another
- Ensure your whole team is looking at the same data
- Avoid SSH-ing into multiple servers just to debug one issue
The real magic happens when you can correlate events. If a user reports they couldn't check out, you can see the payment service was slow, which caused the cart service to time out, which made the front end show an error—all in one place, all connected.
Start centralizing your logs early. You might think, "I only have two services, I can manage," but by the time you really need centralized logging, you'll be drowning in complexity.
Retention Policies: Managing Log Storage
A busy application can generate terabytes of logs in no time, and storage isn't free. This is why we need retention policies. An example policy might look like:
- Keep recent logs (7-14 days) readily available for quick debugging
- Move older logs to cheaper cold storage
- Eventually delete logs you no longer need
Remember that not all logs are created equal. Error logs might be kept for 90 days, while debug logs might only be needed for 24 hours. Regulatory requirements might also dictate how long certain logs must be retained, especially those containing user data or financial transactions.
Conclusion: Building a Logging Culture
Great logging isn't just about technical implementation—it's about building a culture where everyone understands the importance of observability. Make logging a first-class citizen in your development process, not an afterthought.
Remember these key takeaways:
- Log with purpose and structure
- Include enough context to understand what happened
- Use appropriate log levels consistently
- Centralize logs for better visibility
- Implement sampling and retention policies early
- Consider using canonical log lines or distributed tracing
Implementing these best practices in logging will transform your troubleshooting experience. Instead of dreading those 3AM production issues, you'll have the confidence that comes from knowing your logs will actually help you solve problems quickly and efficiently.
Let's Watch!
12 Essential Logging Best Practices That Prevent 3AM Debugging Nightmares
Ready to enhance your neural network?
Access our quantum knowledge cores and upgrade your programming abilities.
Initialize Training Sequence