The Fastest Way to Learn Python for Data Analytics: A Beginner's Roadmap
Sophia Okonkwo
Technical Writer
Python has become an essential skill for data analytics professionals, but many beginners find the learning process intimidating and time-consuming. The good news is that mastering Python for data analytics doesn't have to be complicated. By focusing on the right approach and key libraries, you can learn Python efficiently and effectively, setting yourself up for success in the data analytics field.
Understanding the Python Learning Journey for Data Analytics
Learning Python for data analytics is similar to learning a new language. At first, it might feel challenging as you struggle to express yourself and understand the fundamentals. The initial stage involves grasping basic programming concepts like variables, loops, functions, and other core elements. If you already know another programming language, you'll find many of these concepts transferable.
The common mistake many aspiring data analysts make is getting lost in general Python tutorials that cover everything the language can do. For data analytics specifically, you need to quickly move beyond the basics and focus on the libraries and tools that matter most for working with data.
Essential Python Libraries for Data Analytics
Python libraries are extensions that provide additional functionality beyond the standard language. For data analytics, there are four key libraries you should prioritize learning:
1. NumPy: The Foundation for Numerical Operations
NumPy (Numerical Python) is fundamental for data analytics work. This library excels at numerical operations and working with arrays, which are specialized data structures for storing information efficiently. With NumPy, you can create array objects and perform various mathematical operations on them much faster than with standard Python lists.
import numpy as np

# Creating a simple NumPy array
array = np.array([1, 2, 3, 4, 5])

# Performing operations
print(array * 2)  # Multiplies each element by 2
print(np.mean(array)) # Calculates the mean of the array2. Pandas: The Powerhouse for Data Manipulation
Pandas is arguably the most important library for data analysts. It introduces DataFrames, which are tabular data structures similar to spreadsheets. With Pandas, you can load datasets from various sources, clean missing data, filter and transform information, perform grouping operations, and calculate metrics. It's the workhorse of data preparation and analysis.
import pandas as pd

# Creating a simple DataFrame
df = pd.DataFrame({
    'Name': ['Alice', 'Bob', 'Charlie'],
    'Age': [25, 30, 35],
    'City': ['New York', 'San Francisco', 'Chicago']
})

# Basic operations
print(df.describe())  # Statistical summary
print(df[df['Age'] > 25]) # Filtering data3. Matplotlib: The Classic Visualization Tool
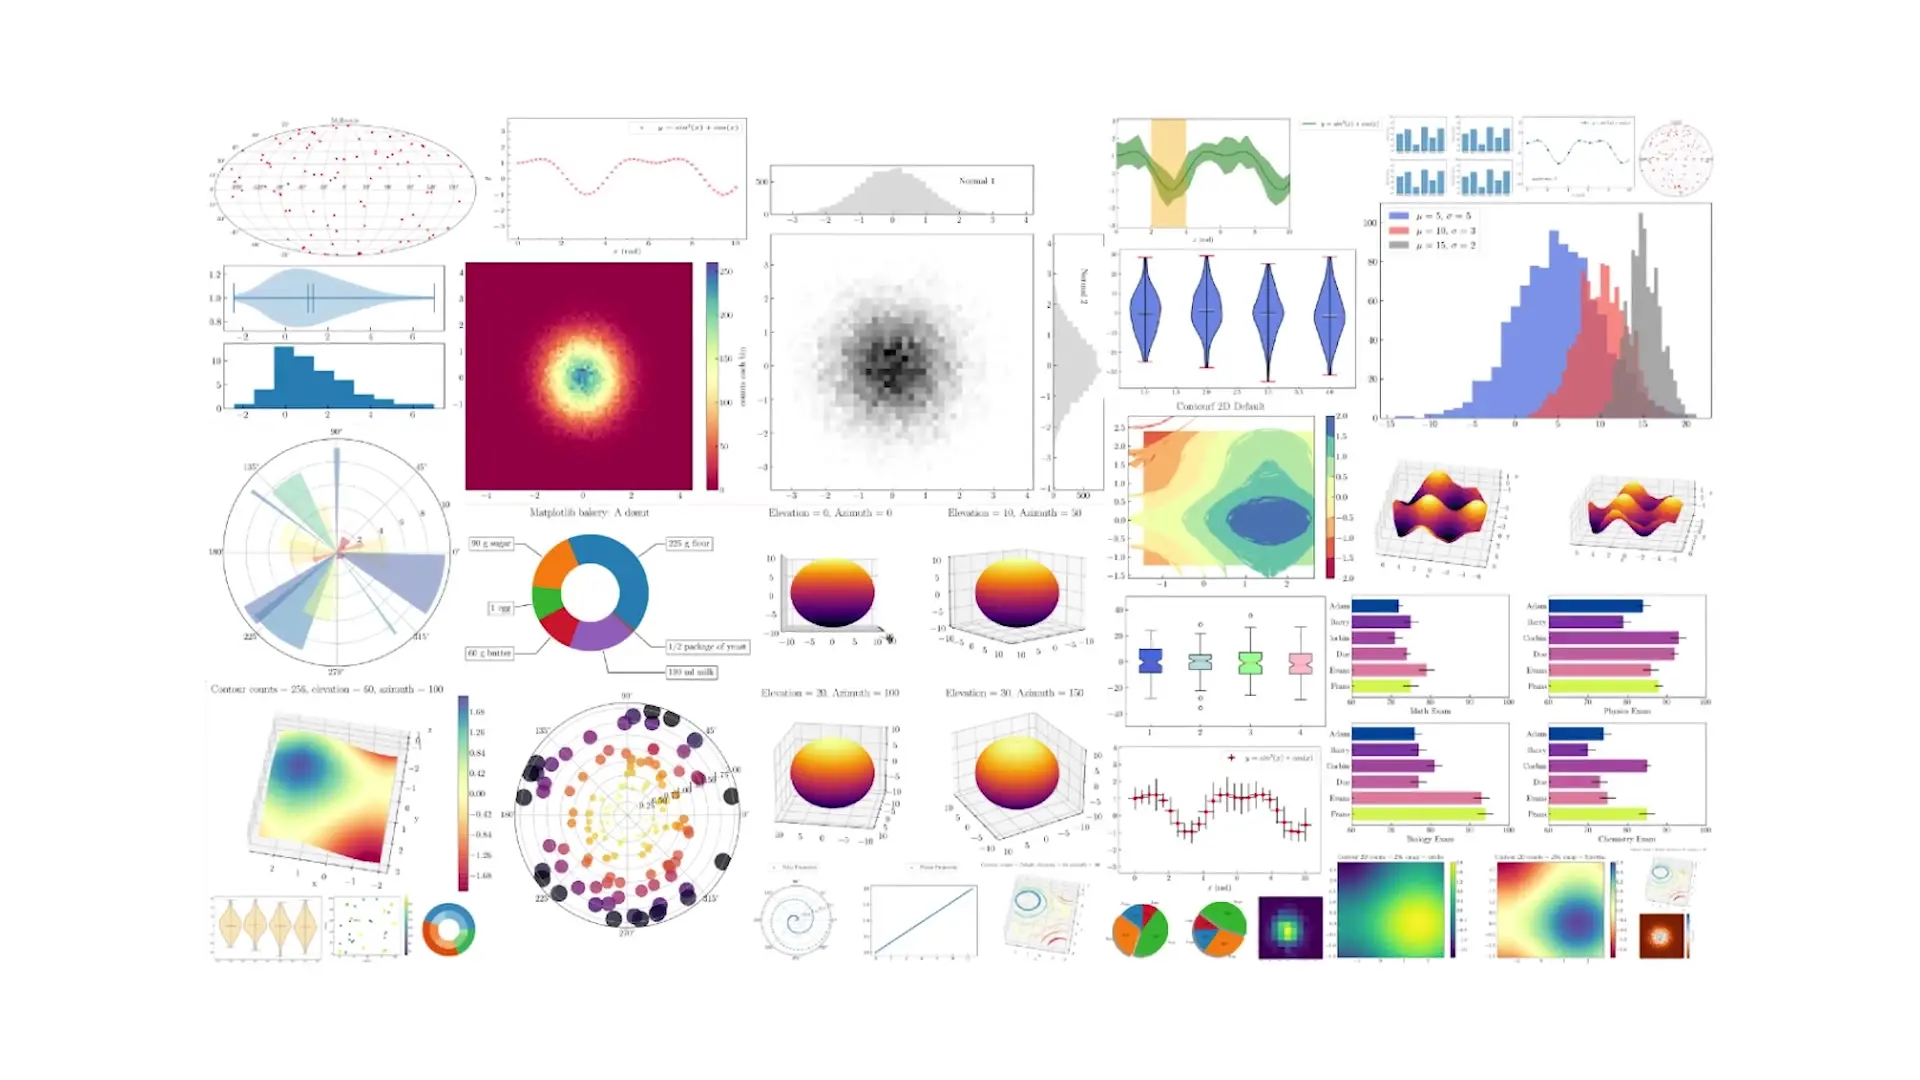
Data visualization is crucial for analytics, and Matplotlib is the foundation of Python's visualization capabilities. This library allows you to create various types of visualizations including line plots, bar charts, histograms, scatter plots, and more. While it has a somewhat steeper learning curve, mastering Matplotlib gives you tremendous control over your visualizations.
import matplotlib.pyplot as plt

# Creating a simple line plot
x = [1, 2, 3, 4, 5]
y = [10, 15, 7, 12, 9]

plt.plot(x, y)
plt.title('Simple Line Plot')
plt.xlabel('X-axis')
plt.ylabel('Y-axis')
plt.show()4. Seaborn: Enhanced Visualizations with Less Code
Seaborn builds on top of Matplotlib to provide a higher-level interface for creating attractive statistical graphics. It comes with improved styling options and additional plot types that make it easier to create sophisticated visualizations with less code. Many data analysts use a combination of Matplotlib and Seaborn to meet their visualization needs.
import seaborn as sns

# Load a sample dataset
tips = sns.load_dataset('tips')

# Create a visualization with Seaborn
sns.scatterplot(x='total_bill', y='tip', hue='time', data=tips)
plt.title('Tips vs Total Bill by Time of Day')
plt.show()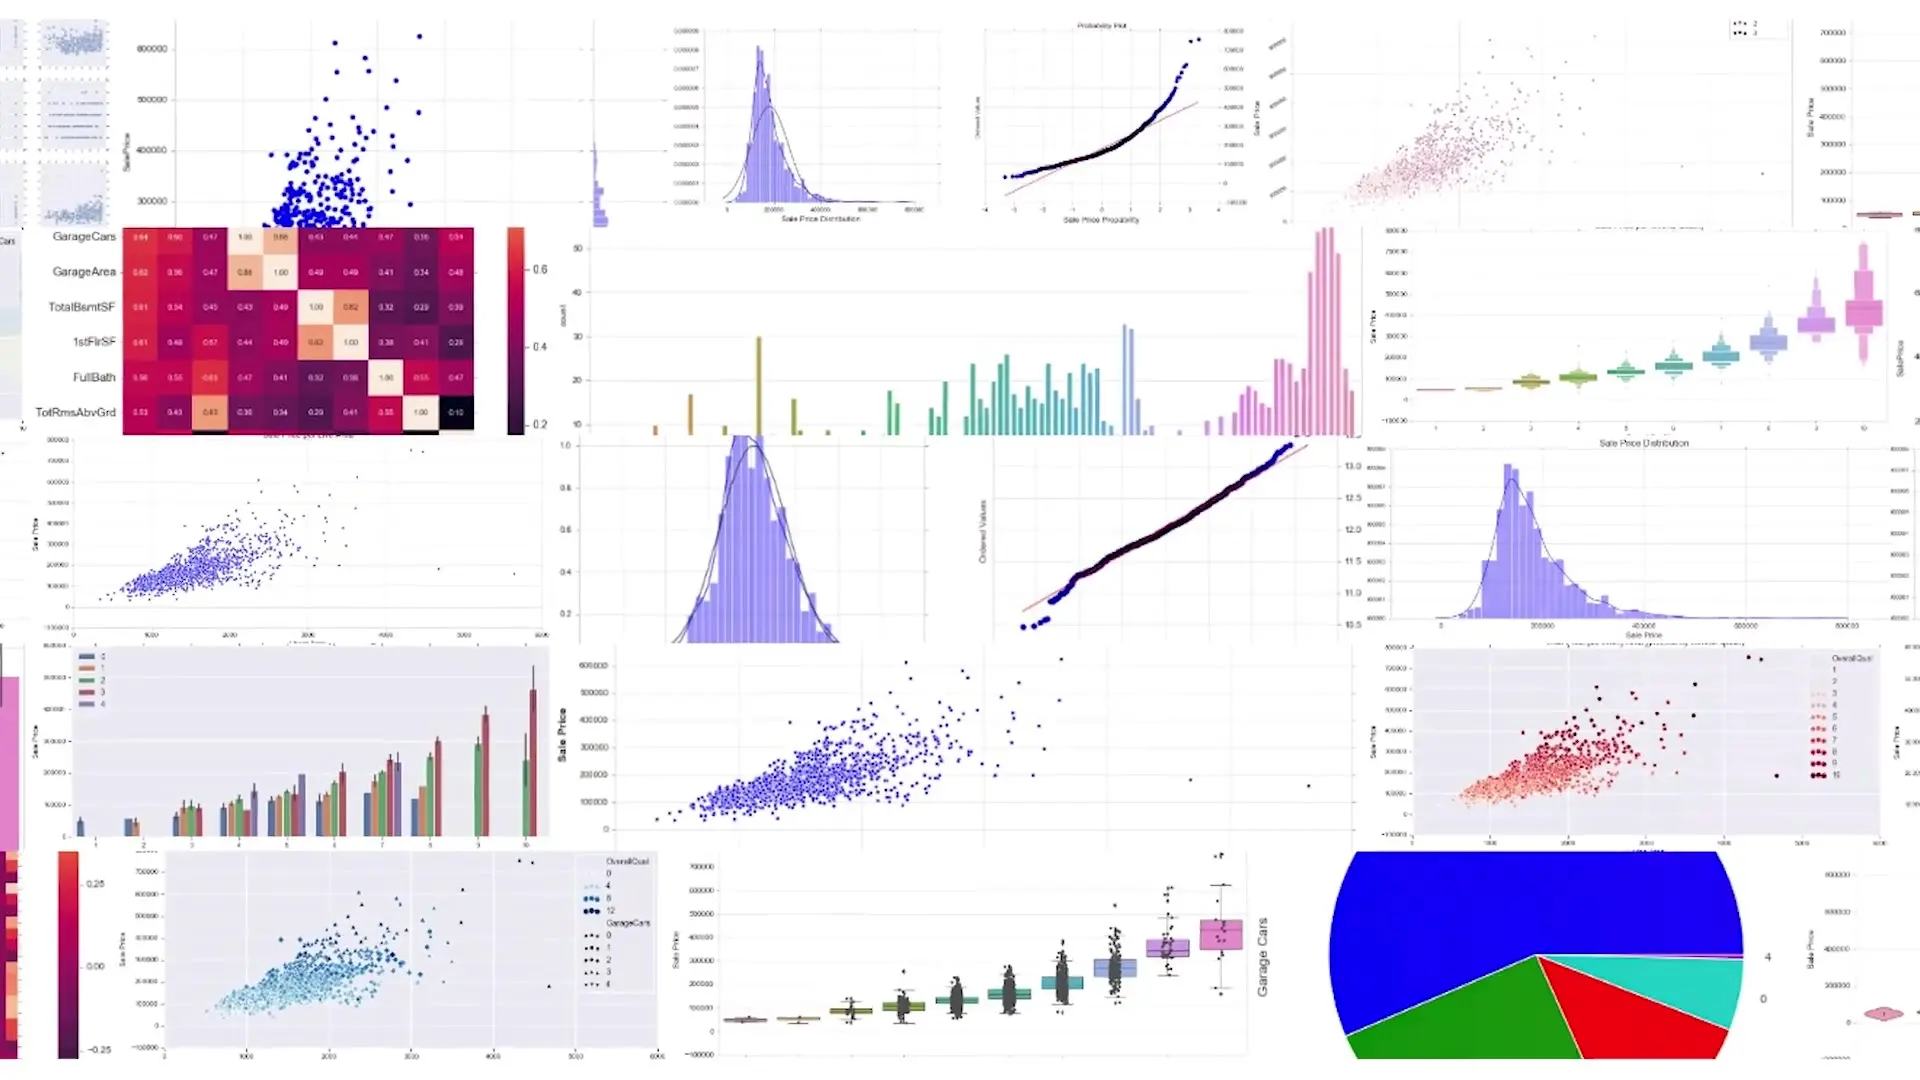
The Most Effective Learning Strategy for Python in Data Analytics
Now that you understand the essential libraries, here's how to approach learning Python for data analytics effectively:
- Start with Python basics: Learn fundamental programming concepts like variables, data types, loops, conditionals, and functions. Spend just enough time here to get comfortable, then move on.
- Focus on data analytics libraries: Rather than learning all of Python, quickly pivot to NumPy, Pandas, Matplotlib, and Seaborn. These tools are what you'll actually use day-to-day as a data analyst.
- Learn by doing: Work with real datasets as soon as possible. Apply what you're learning to practical problems rather than theoretical exercises.
- Build projects: Create small projects that demonstrate your ability to load, clean, analyze, and visualize data. These will reinforce your learning and build your portfolio.
- Practice regularly: Consistent practice is key to mastering Python for data analytics. Even 30 minutes daily is more effective than occasional marathon sessions.

Common Mistakes to Avoid When Learning Python for Data Analytics
- Trying to learn everything about Python instead of focusing on data analytics applications
- Getting stuck in tutorial loops without applying what you've learned to real problems
- Spending too much time on basic Python concepts before moving to specialized libraries
- Learning Python for web development or other purposes when your goal is data analytics
- Not practicing with real-world datasets that reflect the messy nature of actual data work
Why Python Skills Are Highly Valued in Data Analytics
Python skills for data analytics are in high demand across industries because the libraries mentioned above (NumPy, Pandas, Matplotlib, and Seaborn) are used extensively in companies to analyze data and derive insights. Employers value these skills because they directly translate to business value through better decision-making based on data.
Additionally, Python's popularity in the data science ecosystem means that learning these skills opens doors to more advanced areas like machine learning and artificial intelligence if you choose to expand your capabilities later.
Getting Started with Python for Data Analytics Today
The most important thing to remember is that learning Python for data analytics is different from learning Python for general programming, web development, or other applications. By focusing specifically on the tools and techniques relevant to data work, you can accelerate your learning journey and start applying these skills much faster.
Begin with a basic Python course that covers fundamentals, then quickly transition to specialized tutorials and courses on NumPy, Pandas, Matplotlib, and Seaborn. Practice with real datasets, build small projects, and gradually increase the complexity of your analyses as your skills improve.
Remember that Python becomes most useful and enjoyable when you can apply it to solve real problems. Focus on learning exactly what you need for data analytics, and you'll find yourself making rapid progress toward your goal of becoming a proficient data analyst with Python skills.
Let's Watch!
The Fastest Way to Learn Python for Data Analytics in 2023
Ready to enhance your neural network?
Access our quantum knowledge cores and upgrade your programming abilities.
Initialize Training Sequence